
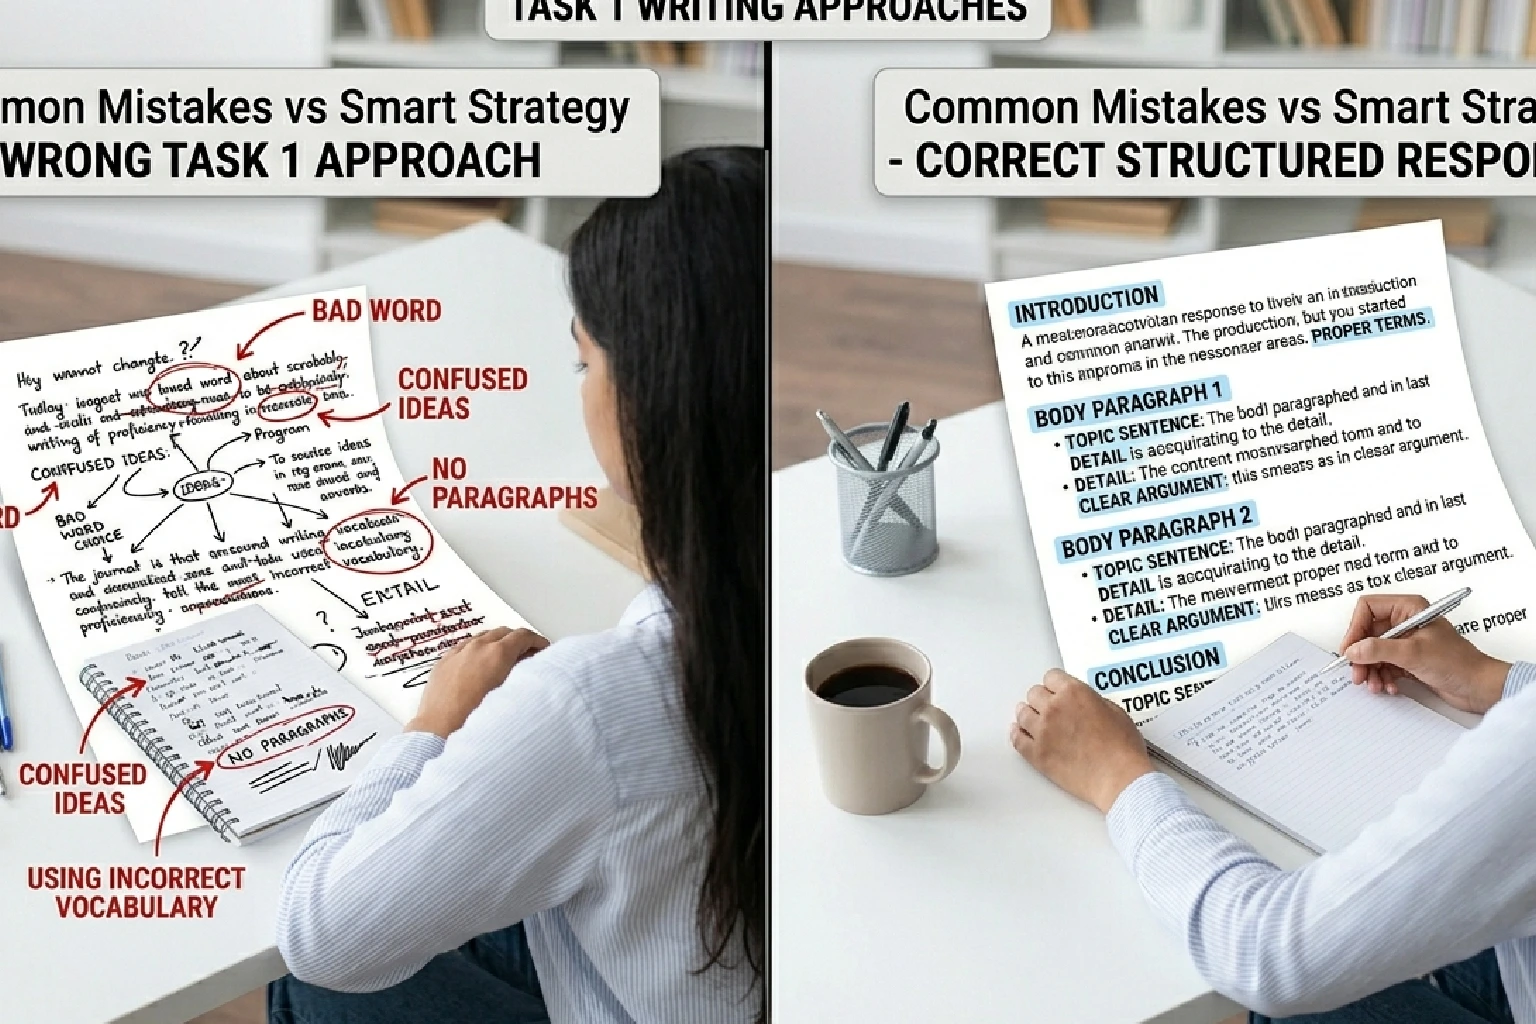
IELTS Writing Task 1 Guide
IELTS Writing Task 1 Bar Chart vs Line Graph: Why Students Lose Easy Marks
Many students think: “It’s just describing a chart – easy marks.” But this is exactly where they lose scores. The problem is not difficulty. It’s misunderstanding the difference between chart types. Let’s break it down clearly.1. Bar Chart vs Line Graph: Basic Difference
Bar Chart
- Used to compare categories. For example, sales of different products or population in different cities.
- Focus is on differences between items, not change over time.
Line Graph
- Shows trends over time. For example, growth, decline, or fluctuations across years.
- Focus is on change, movement, and patterns.
Bar chart = comparison | Line graph = trend
2. Mistake #1: Writing the Same Way for Both
- Students use identical structure for both charts. For instance, describing a line graph like a static comparison instead of showing trends.
Impact
- Loss of Task Achievement marks
3. Mistake #2: Ignoring Trends in Line Graphs
- Students list numbers without explaining change. For example, writing values without mentioning increase, decrease, or fluctuation.
Better approach
- Use words like “rose,” “fell,” “remained stable,” or “fluctuated”
Trend description is essential in line graphs
4. Mistake #3: Over-Describing Every Detail
- Trying to include all data points. For example, describing every bar or every year instead of selecting key features.
Result
- Unclear and cluttered response
5. Mistake #4: Weak Overview
- Overview is missing or too basic. For instance, students fail to summarize main trends or comparisons.
Impact
- Major loss in Task Achievement
Overview carries high weight in scoring
6. Mistake #5: Wrong Vocabulary Usage
- Using trend words for bar charts. For example, writing “increased” when comparing categories instead of describing differences.
- Using comparison words in line graphs incorrectly.
Insight
- Vocabulary must match chart type
7. Mistake #6: Poor Structure
- No clear paragraphing. For example, mixing overview and details in one paragraph.
Better structure
- Introduction
- Overview
- Body Paragraph 1
- Body Paragraph 2
Structure improves clarity and scoring
8. Smart Strategy for Each Chart
Bar Chart Strategy
- Compare highest and lowest values. For example, identify extremes and key differences between categories.
- Group similar data. Combine categories instead of describing each separately.
Line Graph Strategy
- Describe overall trend first. For example, mention whether it increases, decreases, or fluctuates.
- Highlight key changes. Focus on major rises, drops, or stable periods.
Final Verdict
So, why do students lose easy marks in IELTS Writing Task 1?- Using the wrong approach for chart type
- Ignoring trends or comparisons
- Poor structure and overview
Need Help Improving IELTS Writing?
We help students:- Master Task 1 strategies
- Avoid common mistakes
- Achieve higher band scores
